3 – Exploring Simulation Mode in Packet Tracer#
This tutorial continues from where we left off in Tutorial 2. You’ve successfully connected two PCs through two switches, now it’s time to see how the data actually travels using Simulation Mode in Cisco Packet Tracer.
Simulation Mode lets you observe network activity step by step. It’s a powerful learning tool that helps you understand what happens during ARP requests, pings, and frame forwarding across switches.
Part 1 – What Is Simulation Mode?#
Simulation Mode slows down network traffic so you can see exactly what’s happening. It allows you to:
Watch ARP (Address Resolution Protocol) in action
Follow ping (ICMP) packets across the network
See how switches forward frames based on MAC addresses
Inspect each packet at different OSI layers
Think of it as a slow-motion replay for your network.
Part 2 – Switching to Simulation Mode#
Open your existing project from Tutorial 2 in Cisco Packet Tracer.
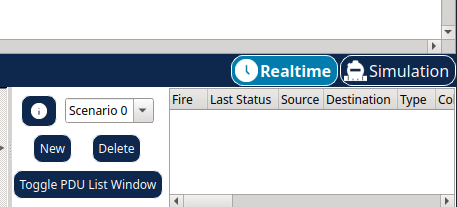
In the bottom-right corner, change from Real-Time to Simulation.
Part 3 – Setting Up a Ping Test#
Step 3.1 – Double-Check Device Setup#
Make sure you’re using the same devices and connections as in Tutorial 2.
Step 3.2 – Start the Ping#
You can initiate a ping in two different ways.
Option 1 – Use the Command Prompt#
Click on PC0.
Open the Desktop tab and select Command Prompt.
Type:
ping 192.168.20.2
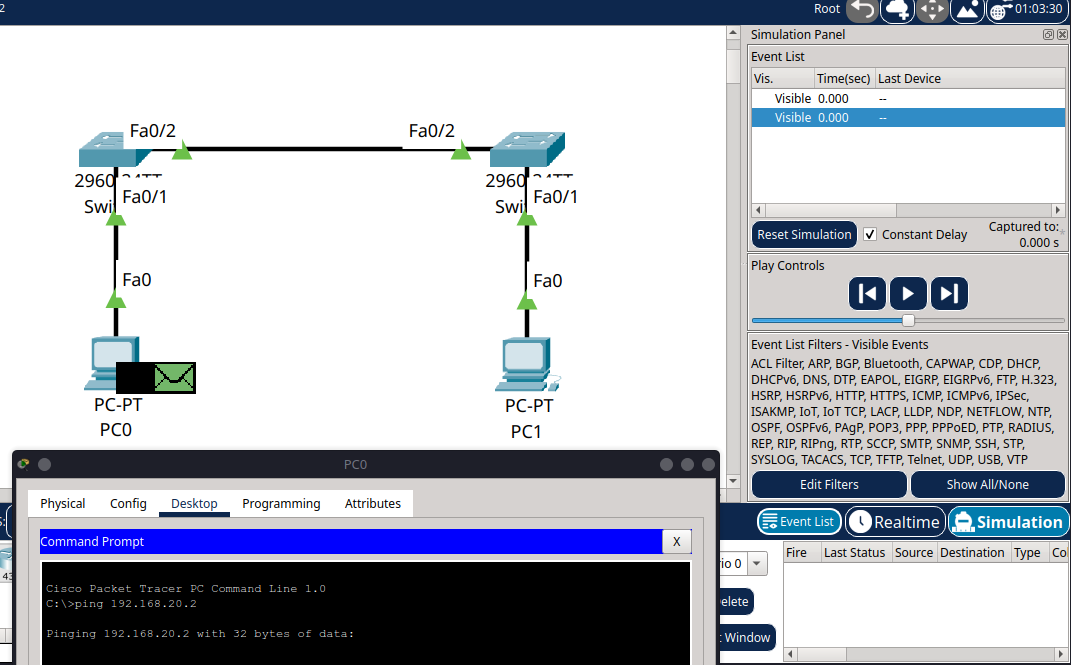
The ping won’t happen immediately, this is expected in Simulation Mode.
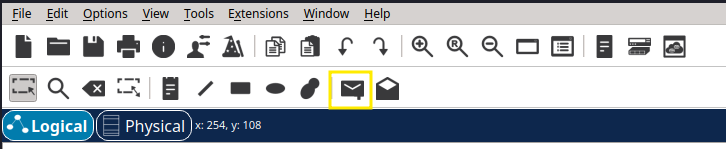
Option 2 – Use the Envelope Button (Simple PDU)#
Click the envelope icon in the bottom-right corner, labelled “Add Simple PDU” (see Figure 6).
Click on PC0, then on PC1 to set up a basic ping between them.
After using either method, press the “Capture / Forward” button repeatedly to move through each step of the simulation.
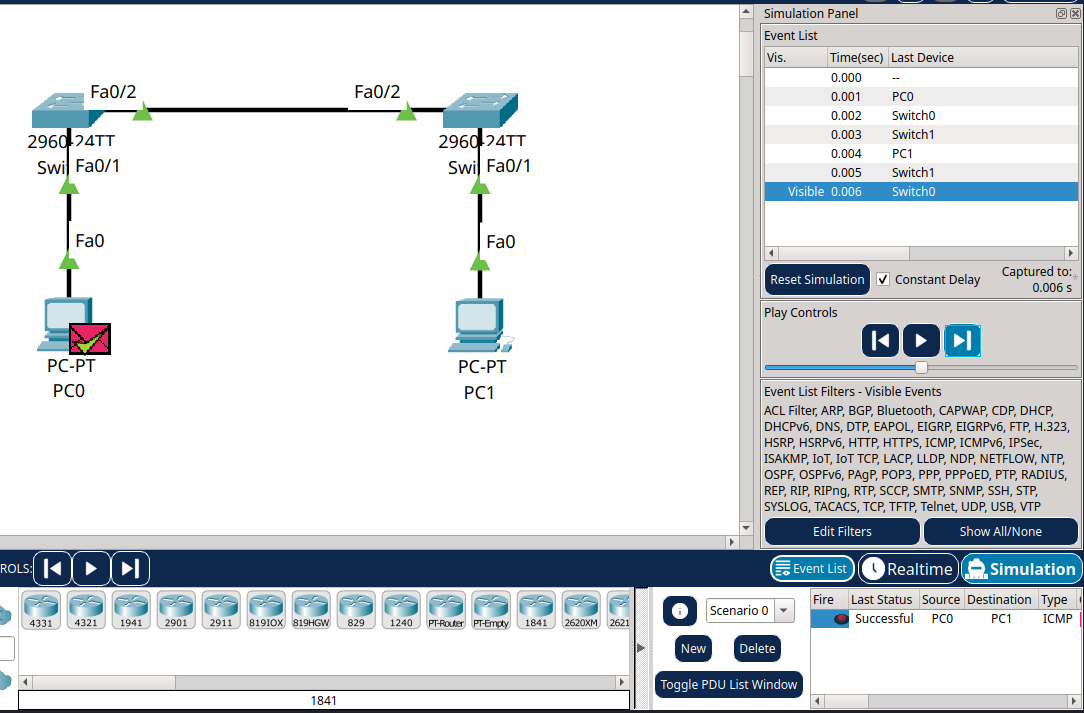
Part 4 – Watching the Packets Move#
You’ll see the following sequence in the Event List:
ARP Request from PC0 asking who has
192.168.20.2Switch0 broadcasts the request
Switch1 forwards it to PC1
PC1 responds with its MAC address
PC0 updates its ARP table
The ping (ICMP Echo Request) is sent
PC1 replies with an ICMP Echo Reply
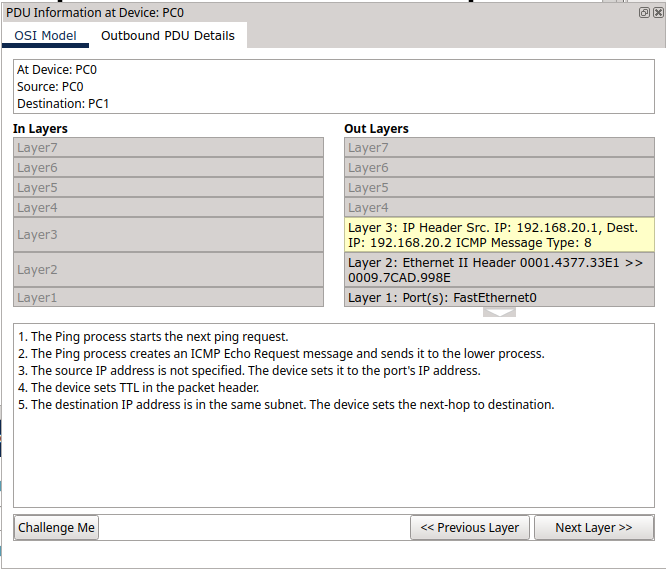
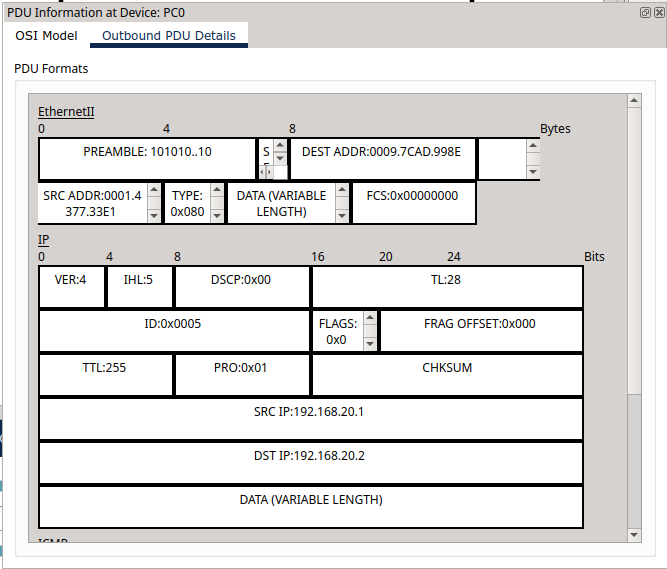
Click on any event in the list, then click “PDU Information” to see detailed info across the OSI layers.
Part 5 – Using Protocol Filters#
To make things clearer, you can filter the protocols shown:
In the Event List Filters on the right, tick or untick protocols like:
ARP
ICMP
DNS, HTTP (if you’re testing other traffic later)
This helps you focus on what’s relevant.
Part 6 – Checking the ARP Table#
You can confirm that MAC addresses have been learned by using the ARP table:
On PC0, open the Command Prompt and type:
arp -aYou should now see the IP and MAC address of PC1 listed.
Summary#
In this tutorial, you:
Switched from Real-Time to Simulation Mode in Cisco Packet Tracer
Initiated and observed a ping between two PCs
Watched ARP requests and ICMP packets move through the network, step by step
Saw how switches forward frames based on MAC addresses
Explored detailed protocol information at each OSI layer using simulation tools